library(ggplot2)
library(grid)

#Borrowed (i.e. stollen) from http://research.stowers-institute.org/efg/R/Color/Chart/ColorChart.R
getColorHexAndDecimal <- function(color) {
    if(is.na(color)) {
        return(NA)
    } else {
        c <- col2rgb(color)
        return(sprintf("#%02X%02X%02X   %3d %3d %3d", c[1],c[2],c[3], c[1], c[2], c[3]))
    }
}Graphic Parameters (symbols, line types, and colors) for ggplot2
R
Following up on John Mount’s post on remembering symbol parameters in ggplot2, I decided to give it a try and included symbols, line types, and colors (based upon Earl Glynn’s wonderful color chart). Code follows below.
Symbols
ggplot(data=data.frame(x=c(0:25))) + geom_point(size=10, aes(x=x,y=x,shape=x)) +
    facet_wrap(~ x, scales='free') + xlab('') + ylab('') +
    scale_shape_identity() +
    theme_void()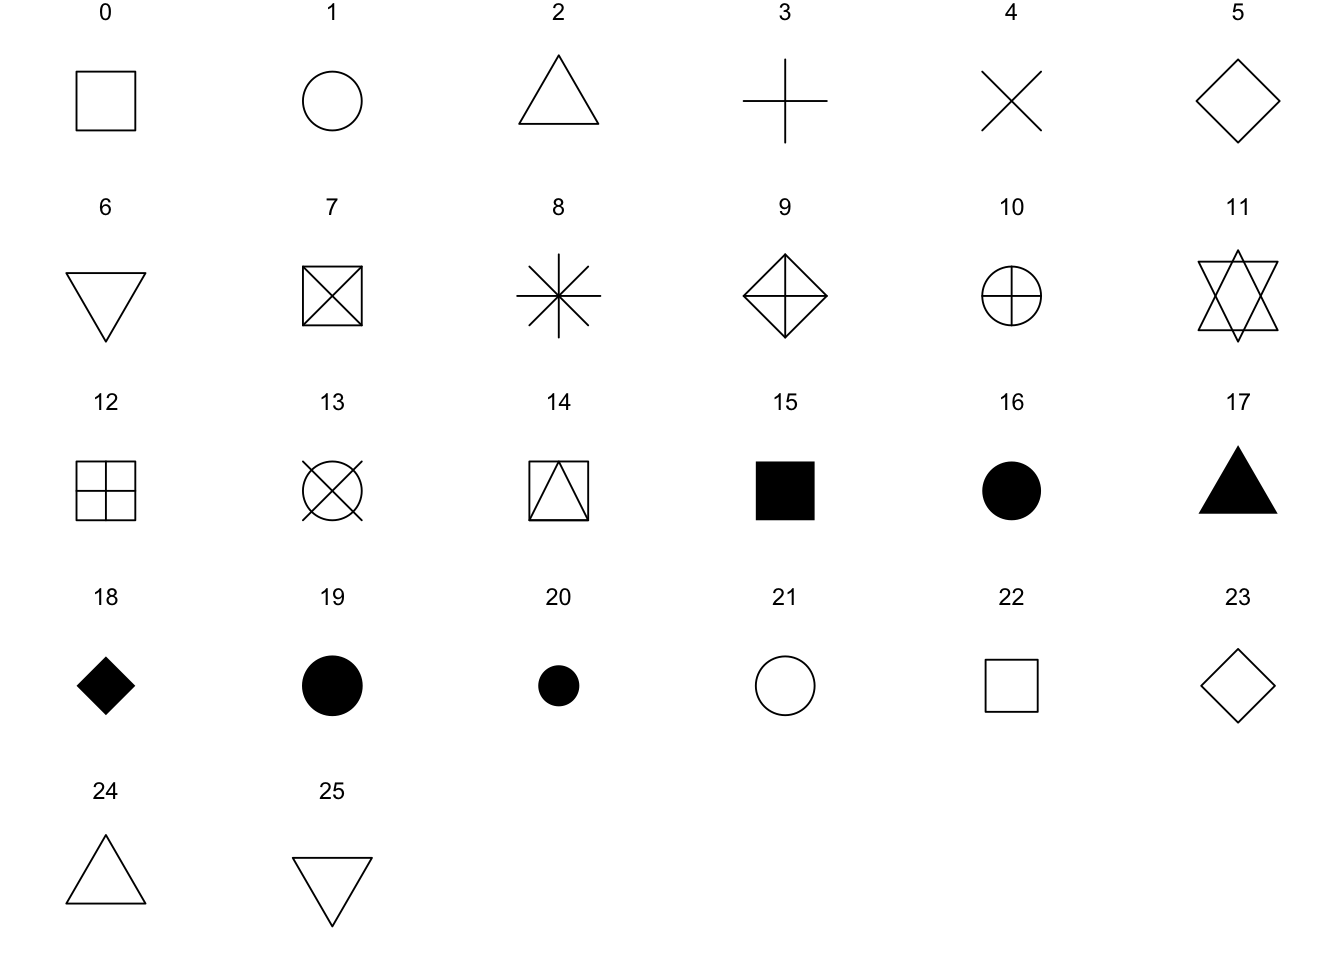
Line types
ggplot(data=data.frame(x=c(1:6))) + geom_hline(size=2, aes(yintercept=x, linetype=x)) +
    scale_linetype_identity() +
    xlab(NULL) + ylab(NULL) + xlim(c(0,100)) +
    theme_void()
Warning: Using `size` aesthetic for lines was deprecated in ggplot2 3.4.0.
ℹ Please use `linewidth` instead.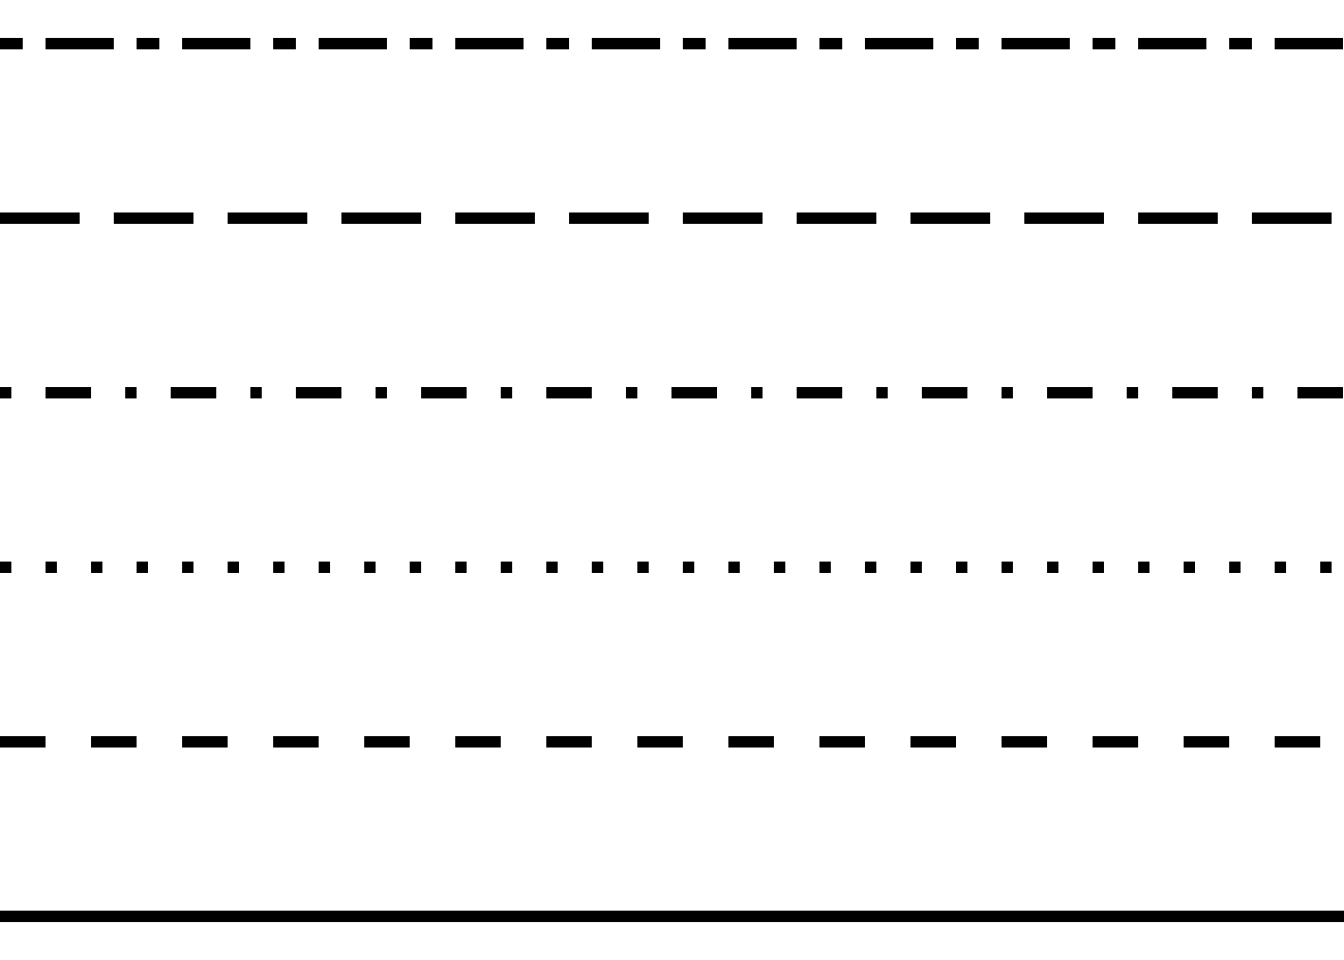
Colors
df = data.frame(x=rep(1:26, 26), y=rep(1:26, each=26))
df$c = NA
df[1:length(colors()),'c'] = colors()
df$n = NA
df[1:length(colors()),'n'] = 1:length(colors())
df$r = df$g = df$b = NA
df[1:length(colors()),c('r','g','b')] = t(col2rgb(colors()))
df$text = ifelse(apply(df[,c('r','g','b')], 1, sum) > (255*3/2), 'black', 'white')
df$hex = lapply(df$c, getColorHexAndDecimal)
df$hex2 = paste(format(df$n, width = 3),
                format(df$c, width = (max(nchar(df$c), na.rm = TRUE) + 1)),
                format(df$hex, width = (max(nchar(df$hex), na.rm = TRUE) + 1)))

ggplot(df, aes(x=x, y=y, fill=c, label=n)) + geom_tile() + geom_text(aes(colour=text), size=3) +
    scale_fill_identity() +
    scale_colour_identity() +
    xlab(NULL) + ylab(NULL) +
    theme_void()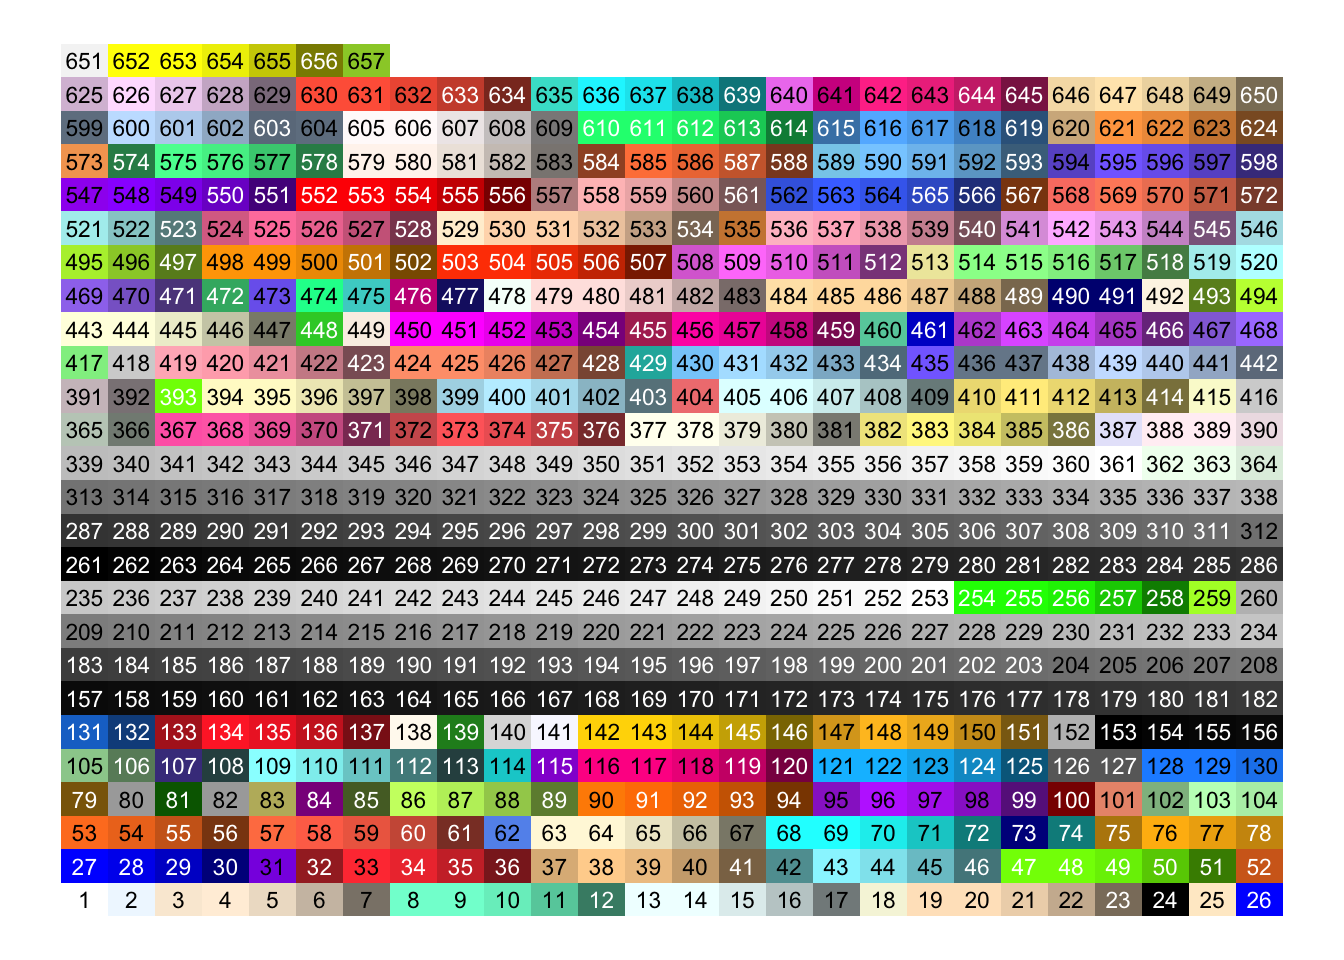
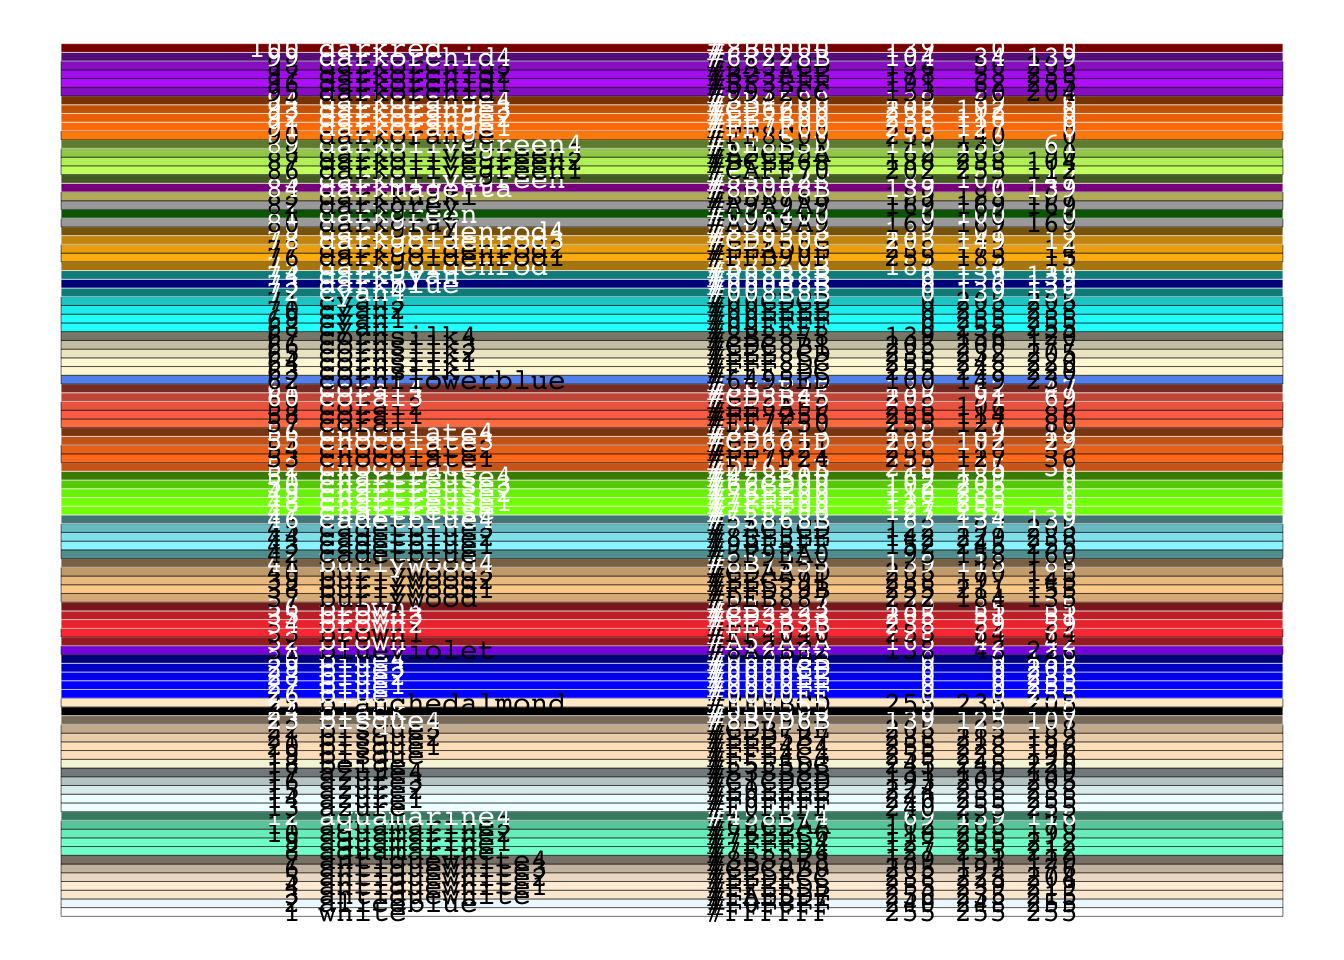
This last one is only the first 100 elements in colors(). Use the script file to generate the remaining plots if you like.
ggplot(df[1:100,], aes(x=1, y=n, fill=c, label=hex2, colour=text)) +
    geom_tile() + geom_text(family = 'mono') +
    scale_fill_identity() +
    scale_colour_identity() +
    xlab(NULL) + ylab(NULL) +
    theme_void()