remotes::install_github('jbryer/ipeds')The use of SAT/ACT for college admissions
R
The post explores the changing landscape of using SAT/ACT for college admissions using the Integrated Postsecondary Education Data System (IPEDS).
I have been working on a presentation regarding college readiness and the use of SAT/ACT for college admissions as part of the Diagnostic Assessment and Achievement of College Skills. I wanted to see how the use of these high-stakes assessments have changed over the last decade. Turns out that I wrote a package years ago to work with the Integrated Postsecondary Education Data System, ipeds and fortunately it still works! Currenlty, it is only on Github and can be installed using the remotes package.
The surveys data frame included in the package provides metadata for the different data files available from the IPEDS website. The AHD data file provides directory information for each institution in the United States.
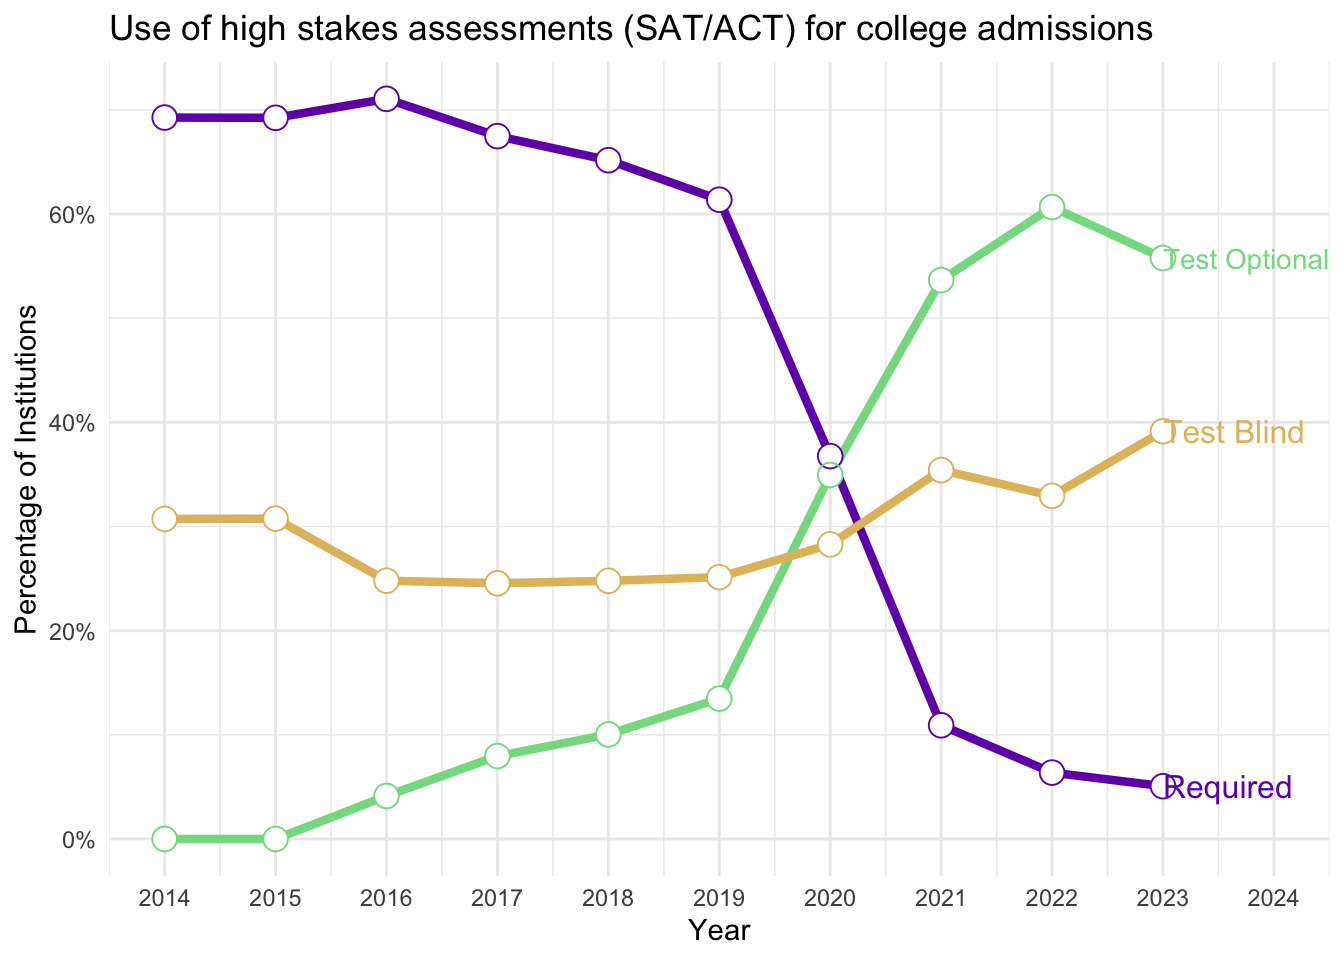
data(surveys, package = 'ipeds')We are interested in the admcon7 variable which has three levels indicating how each institution uses tests for admissions decisions.
levels <- c('1' = 'Required',
            '5' = 'Test Optional',
            '3' = 'Test Blind')
The following block will download the directory information for 2014 through 2023 (the latest year currently available).
admissions <- data.frame()
years <- 2014:2023
for(i in years) {
    adm <- getIPEDSSurvey('ADM', year = i)
    adm$admcon7 <- factor(adm$admcon7,
                          levels = names(levels),
                          labels = levels)
    adm$year <- i
    admissions <- rbind(admissions, adm[,c('year', 'admcon7')])
}
The figure below shows a pretty striking change in how institutions have used high stakes assessments like the SAT and ACT for admissions decisions around 2020 (not sure what happened that year 😉).
tab <- table(admissions$year, admissions$admcon7) |>
    prop.table(1) |>
    reshape2::melt() |>
    dplyr::rename(Year = Var1, Test_Use = Var2)

p <- ggplot(tab, aes(x = Year, y = value, group = Test_Use, color = Test_Use)) +
    geom_path(linewidth = 1.5) +
    geom_point(shape = 16, size = 4, color = 'white') +
    geom_point(shape = 1, size = 4) +
    scale_color_manual('Test usage: ',
                       values = c('Required' = '#7209B7',
                                  'Test Optional' = '#84DB8F',
                                  'Test Blind' = '#E2BD6B')) +
    scale_y_continuous(labels = scales::percent) +
    scale_x_continuous(breaks = c(years, max(years) + 1),
                       labels = c(years, max(years) + 1),
                       limits = c(min(years), max(years) + 1)) +
    theme_minimal() +
    # xlim(c(2014, 2024)) +
    theme(legend.position = 'bottom') +
    ggtitle('Use of high stakes assessments (SAT/ACT) for college admissions') +
    ylab('Percentage of Institutions')

directlabels::direct.label(p, "last.qp")